Using a weather API, this project visually represents the current weather in New York City through a concentric map.
View project
HERE.
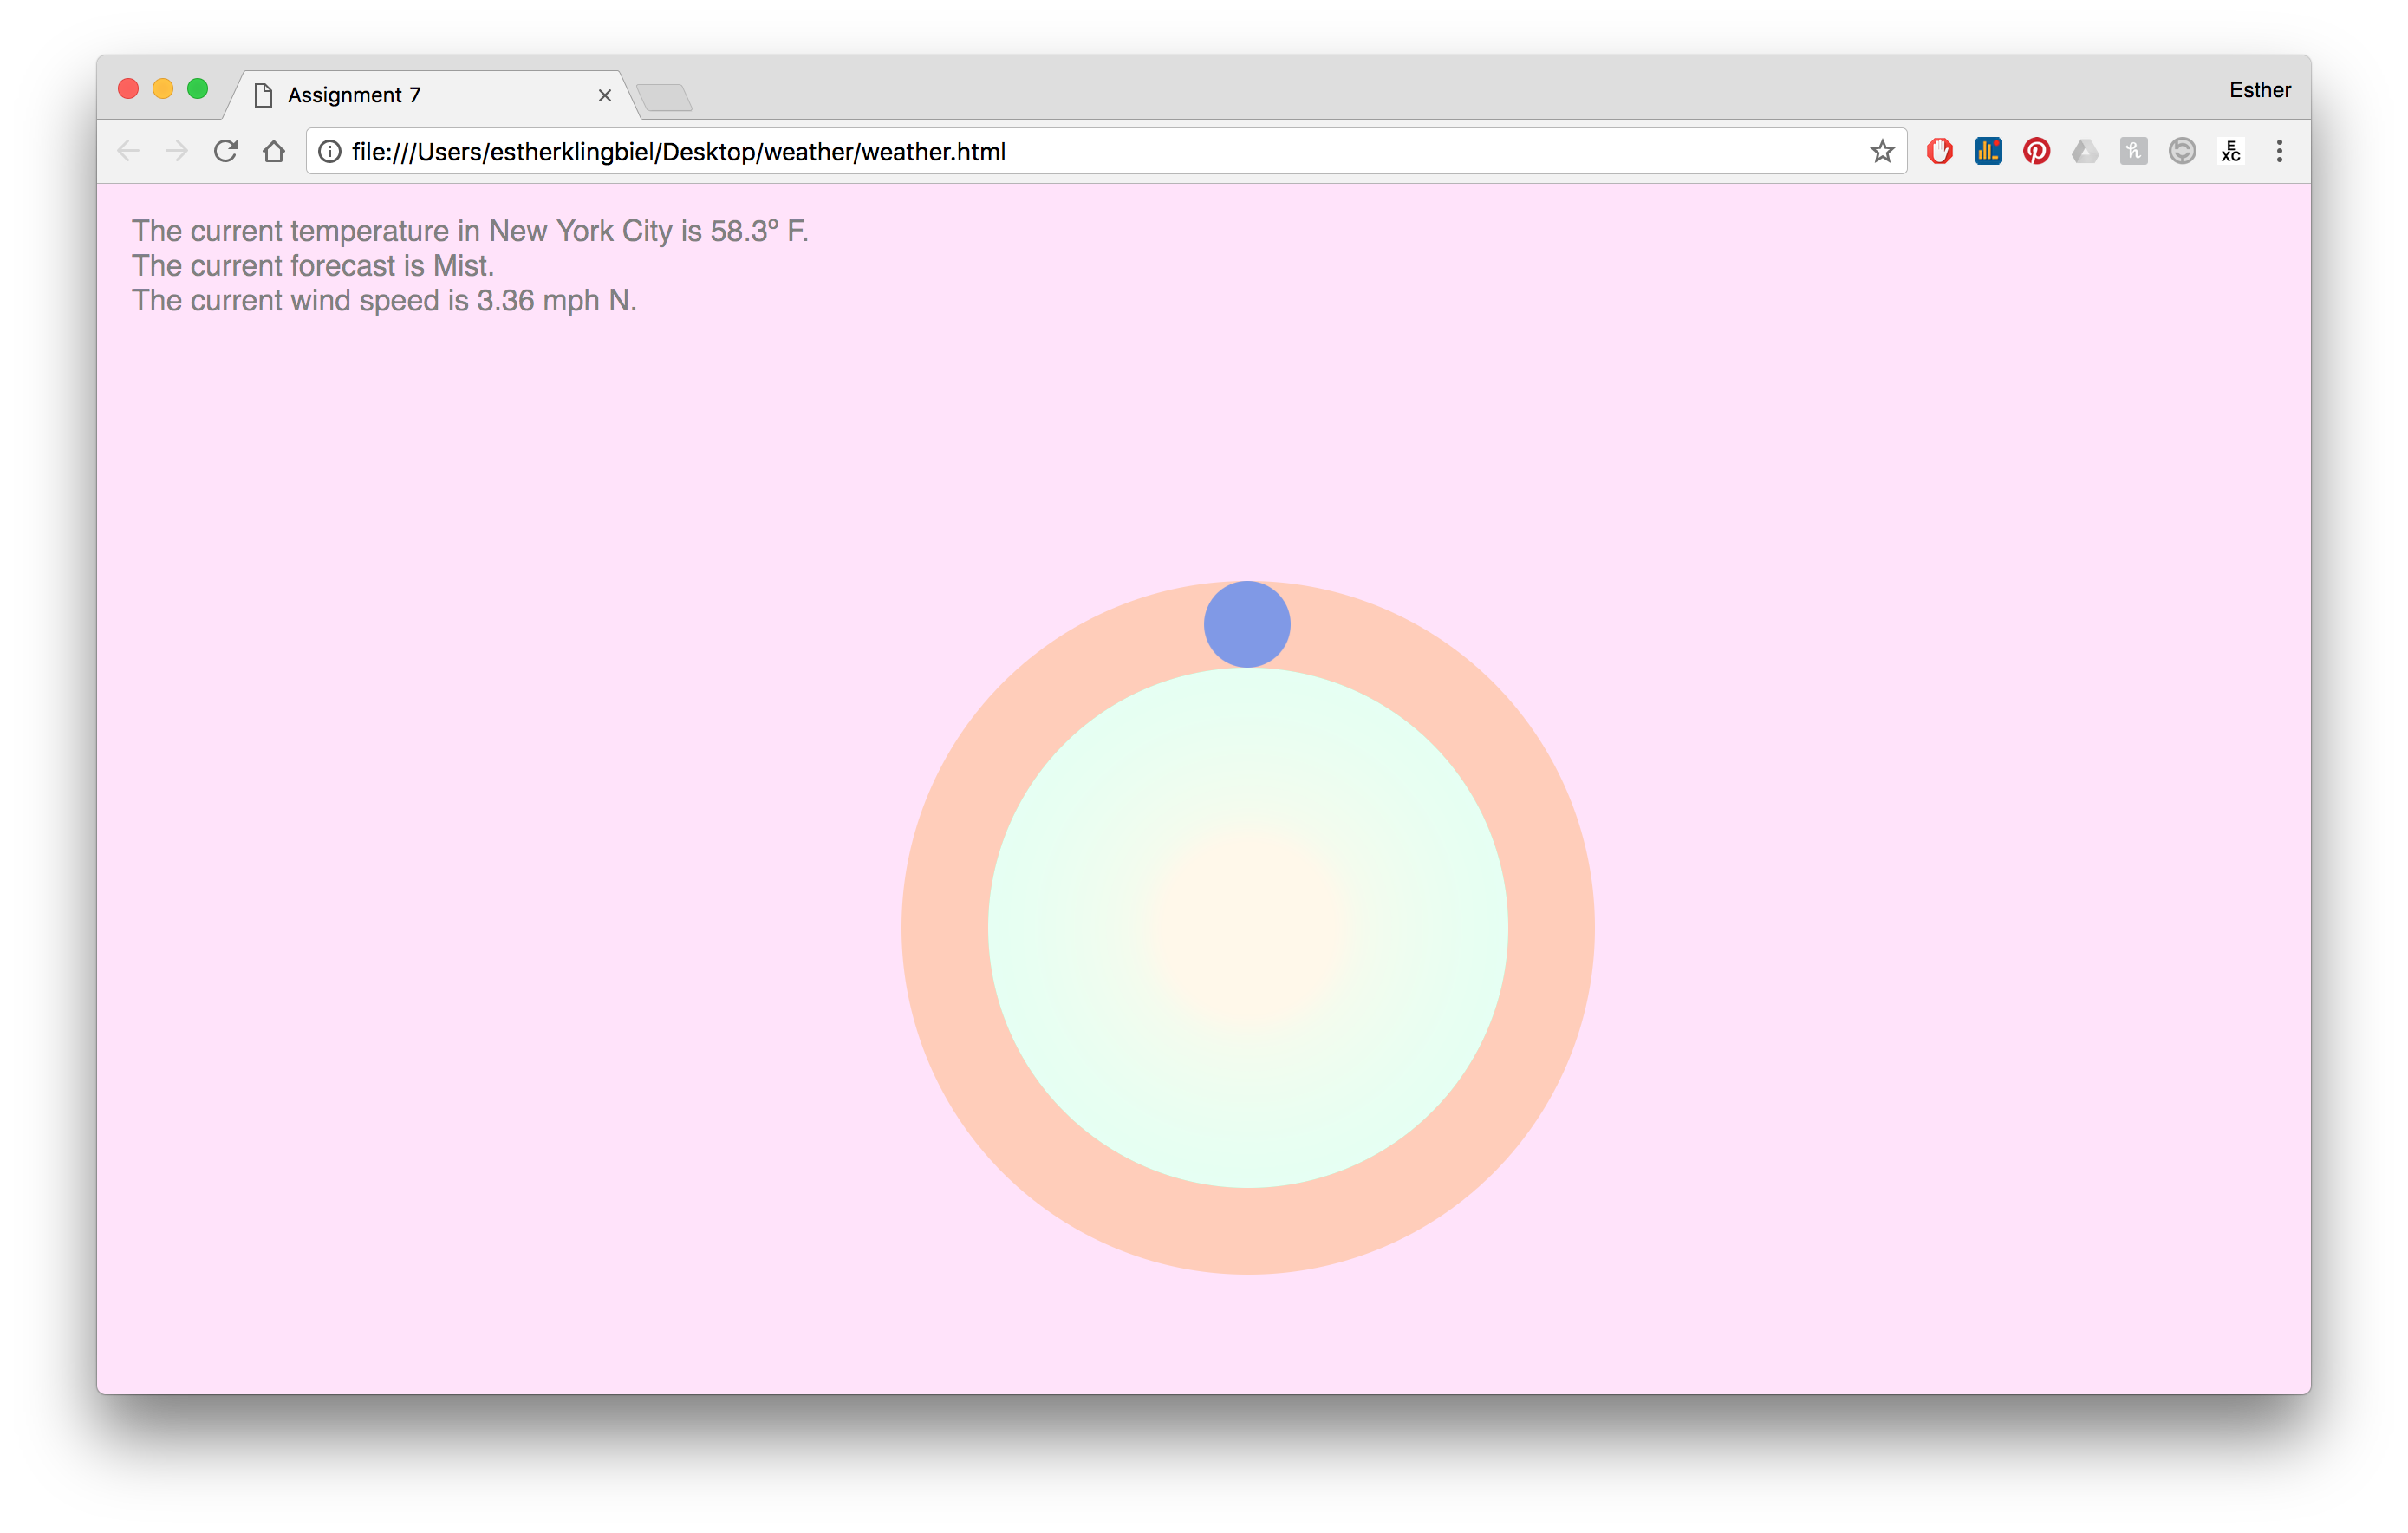
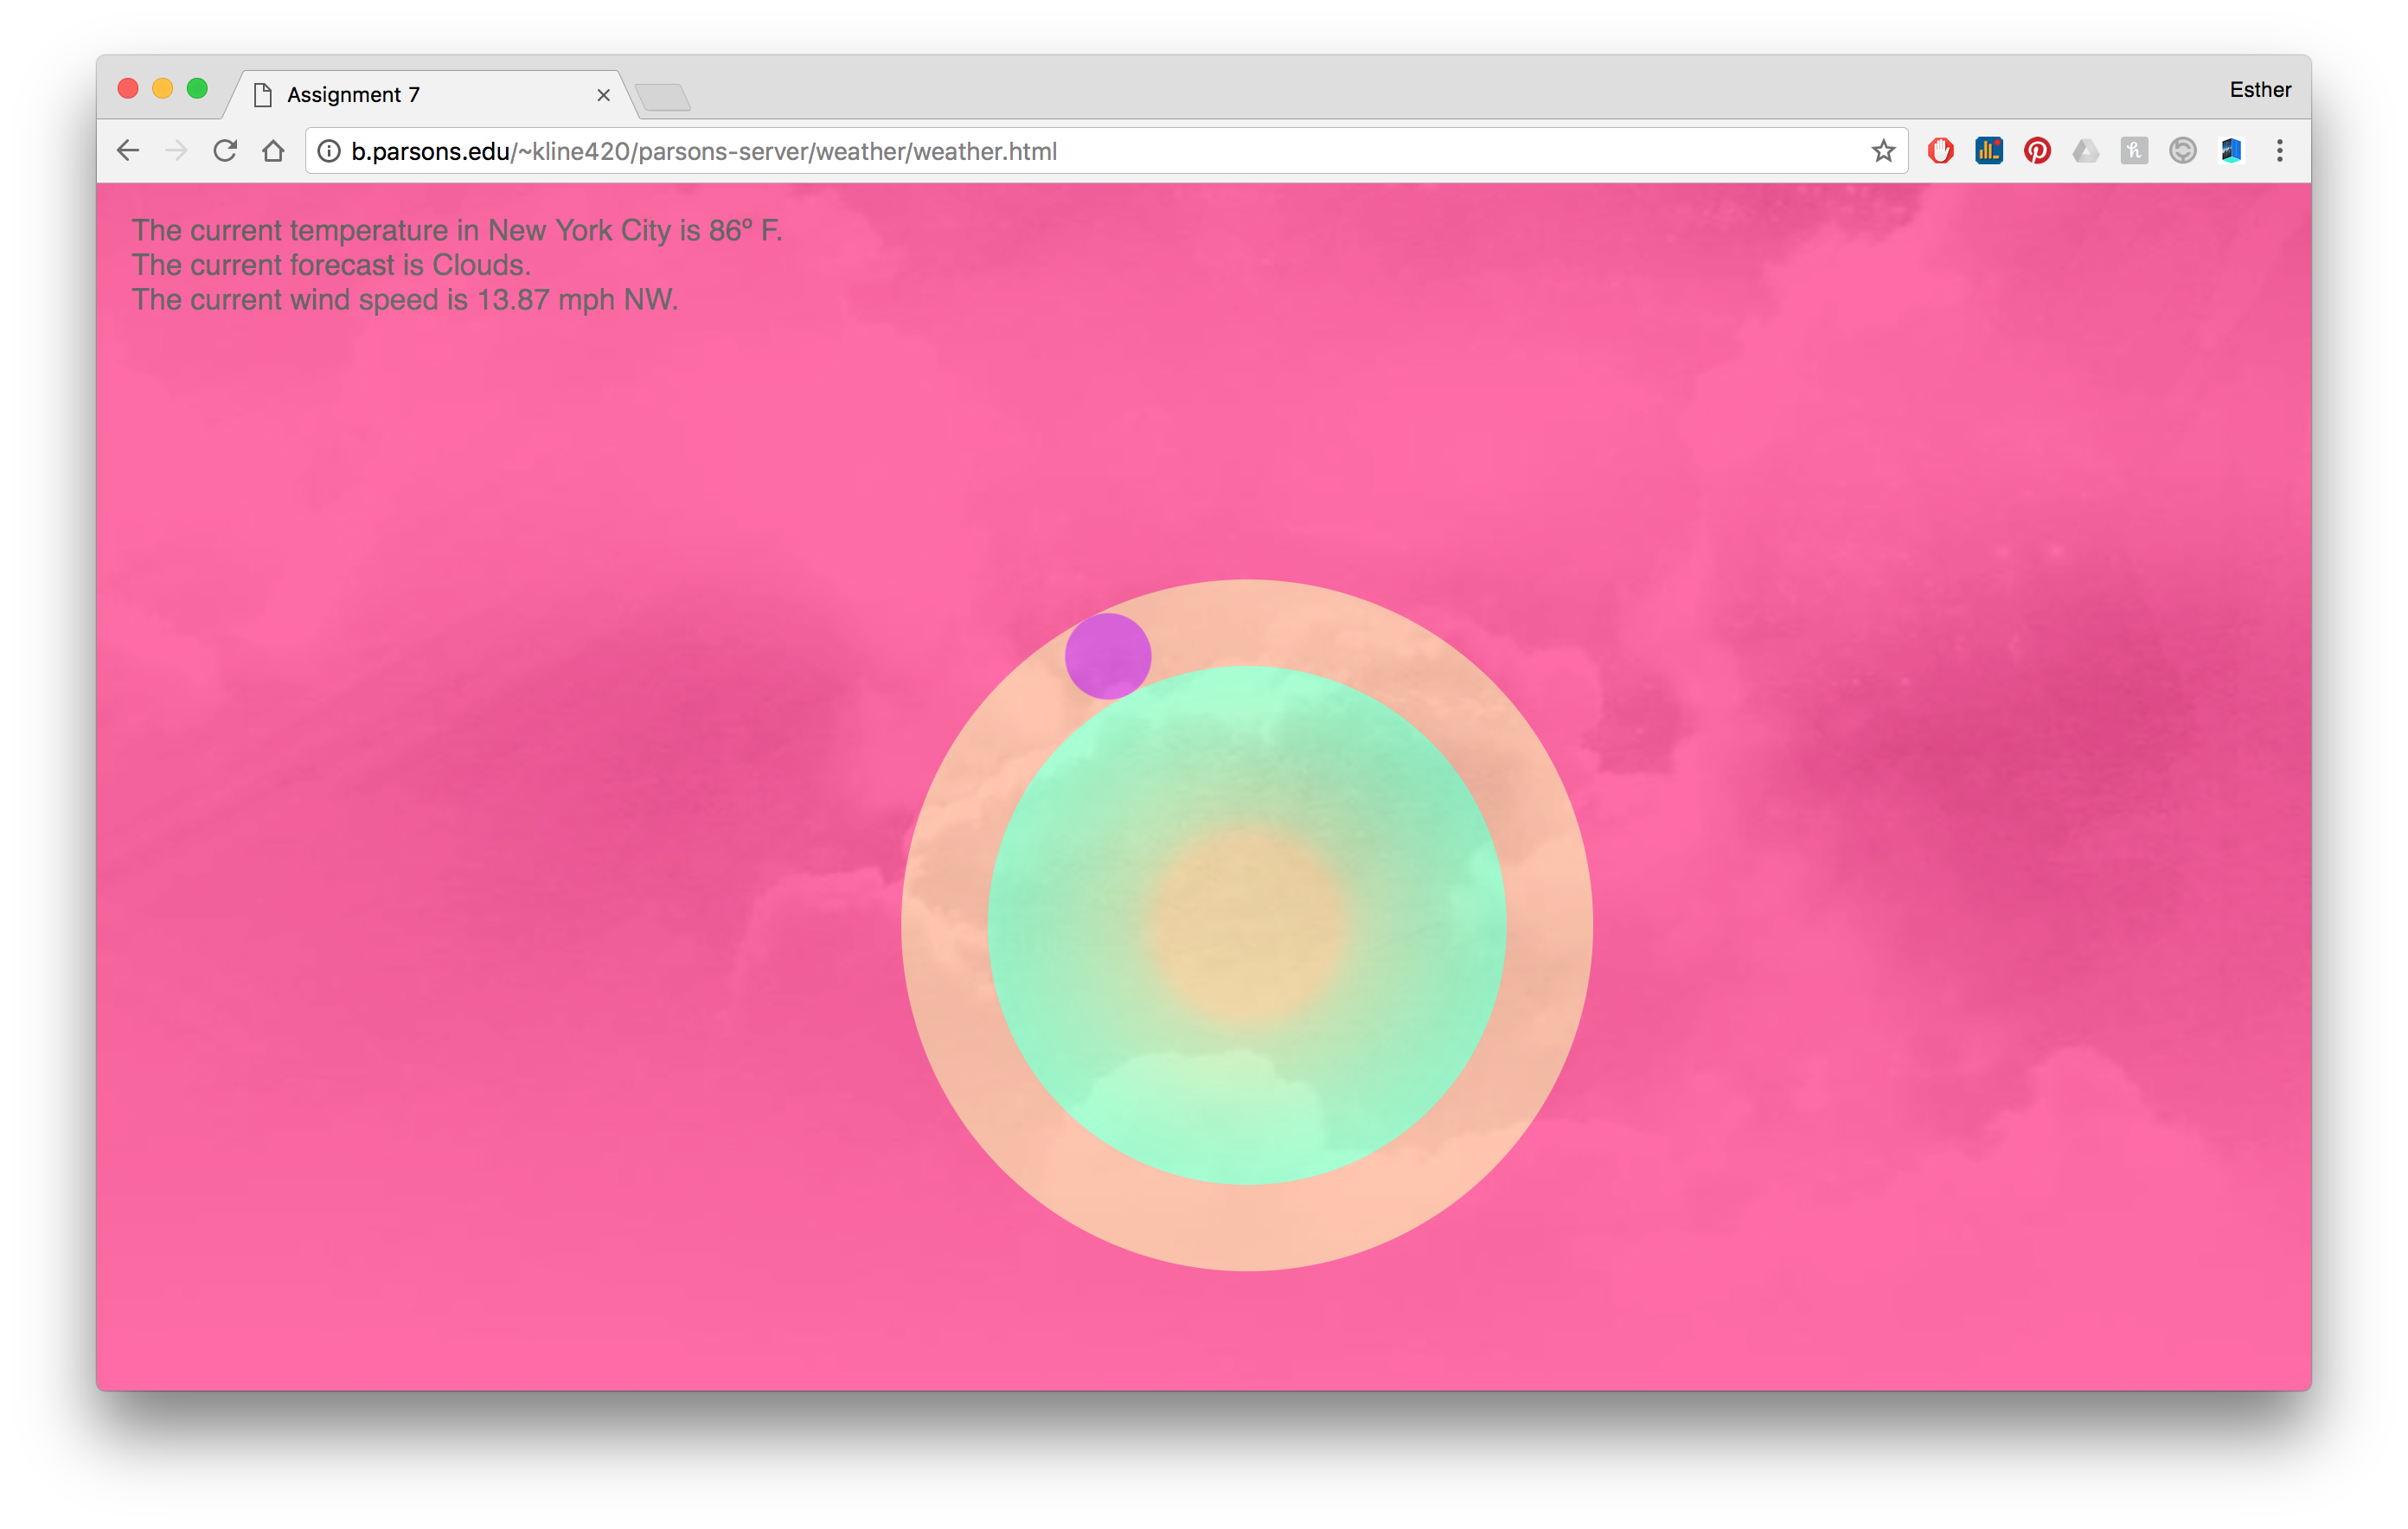
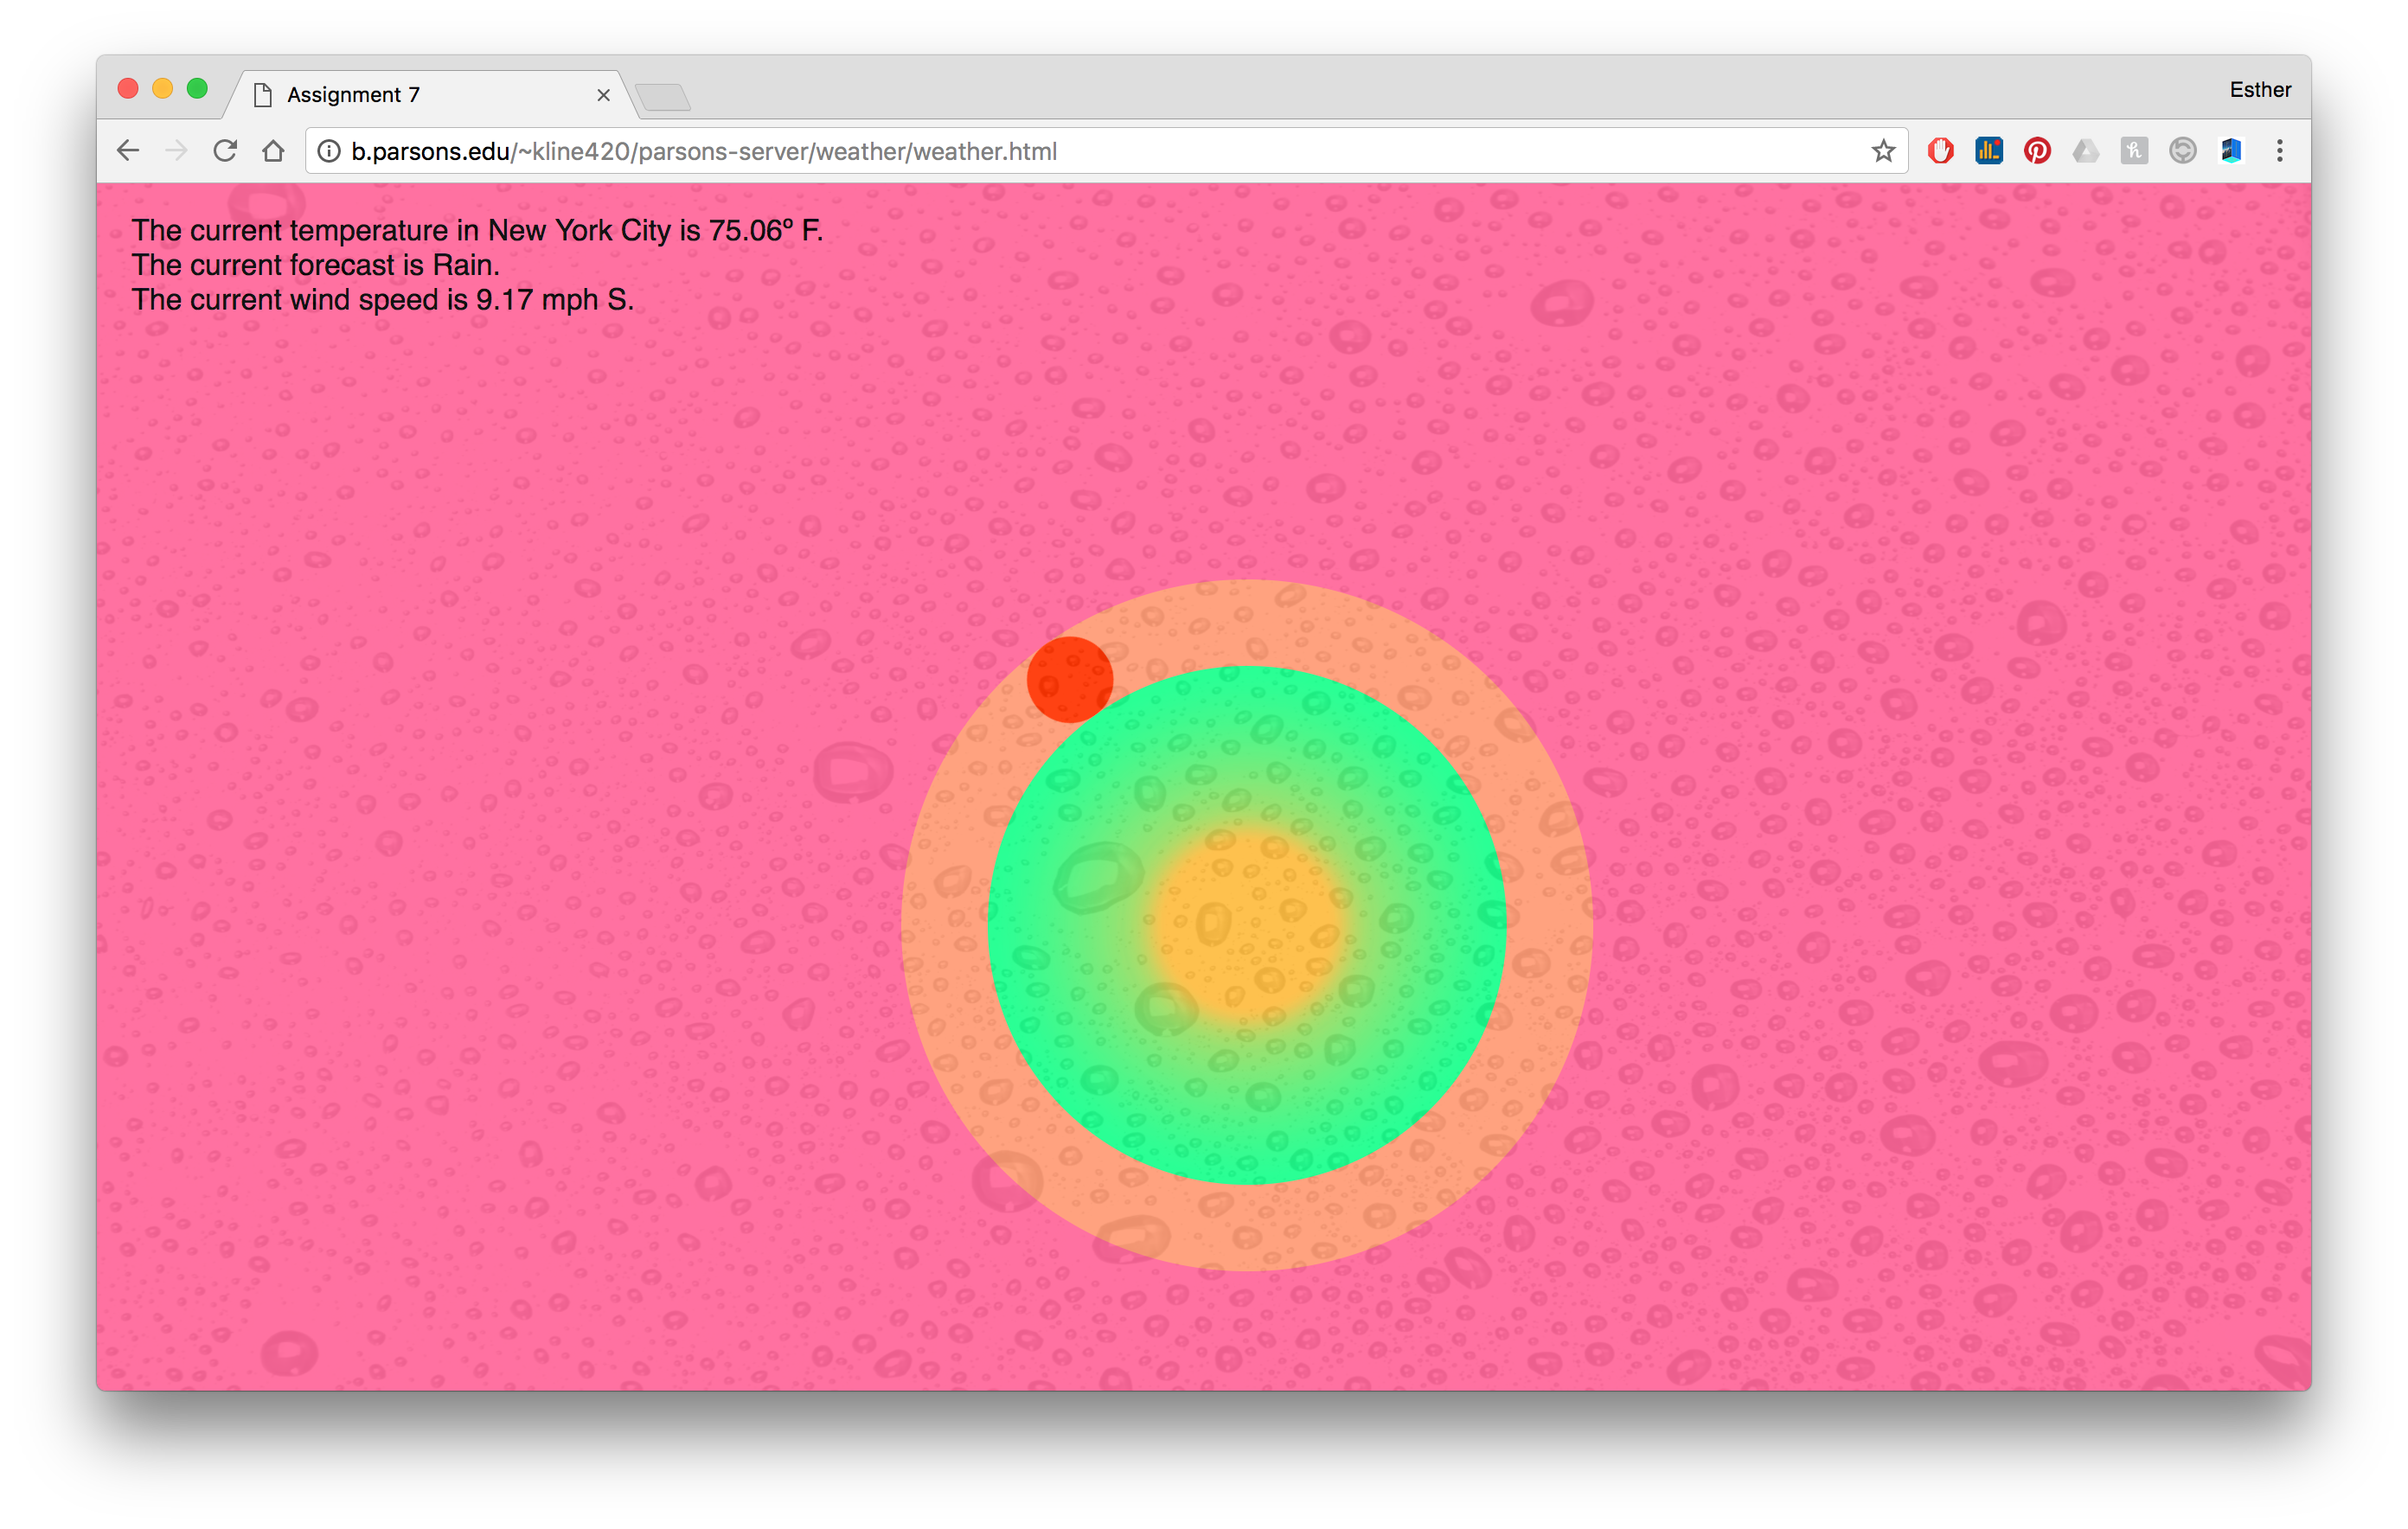
In the top left-hand corner of the map, there is a block of text describing the current temperature, forecast, wind speed, and wind direction that updates when the page is refreshed. The background color of the page is based on the current temperature. The warmer the temperature, the warmer the color.
In the center of the map is a double-ringed circle, with a smaller circle rotating around the middle circle. The center of the circle holds an image of the sun, however you may not be able to see it—a div is positioned over it, which is programmed to change in opacity based on the number of clouds in the sky. The more clouds, the less visible the sun is.
The smaller circle that rotates moves based on the current wind speed. The higher the wind speed, the faster it rotates. The circle's color is also based on the wind's direction.