Concrete & Asphalt
Dark, impermeable surfaces absorb sunlight all day and release it after sunset, raising night temperatures.
The Big Picture
Longer summers, hotter nights, and record-breaking heat waves are yearly realities. But the damage isn’t distributed equally — urban design and policy choices make some blocks far more dangerous than others.
Who’s affected →These figures show why heat is more than a summer inconvenience — it’s a public health emergency.
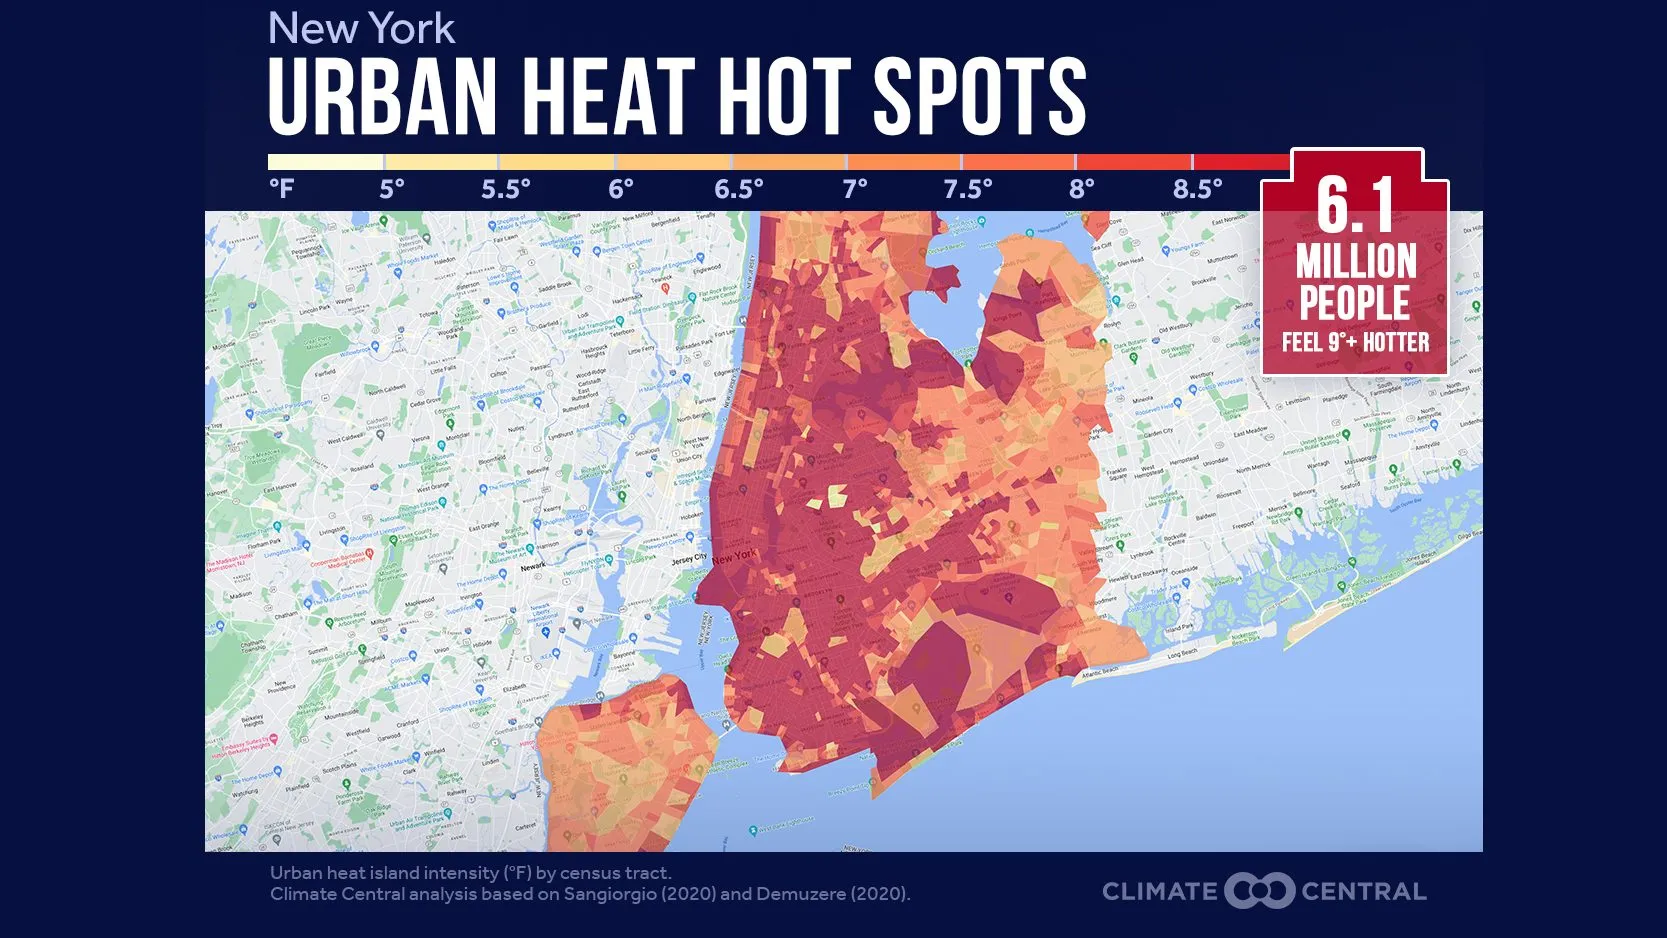
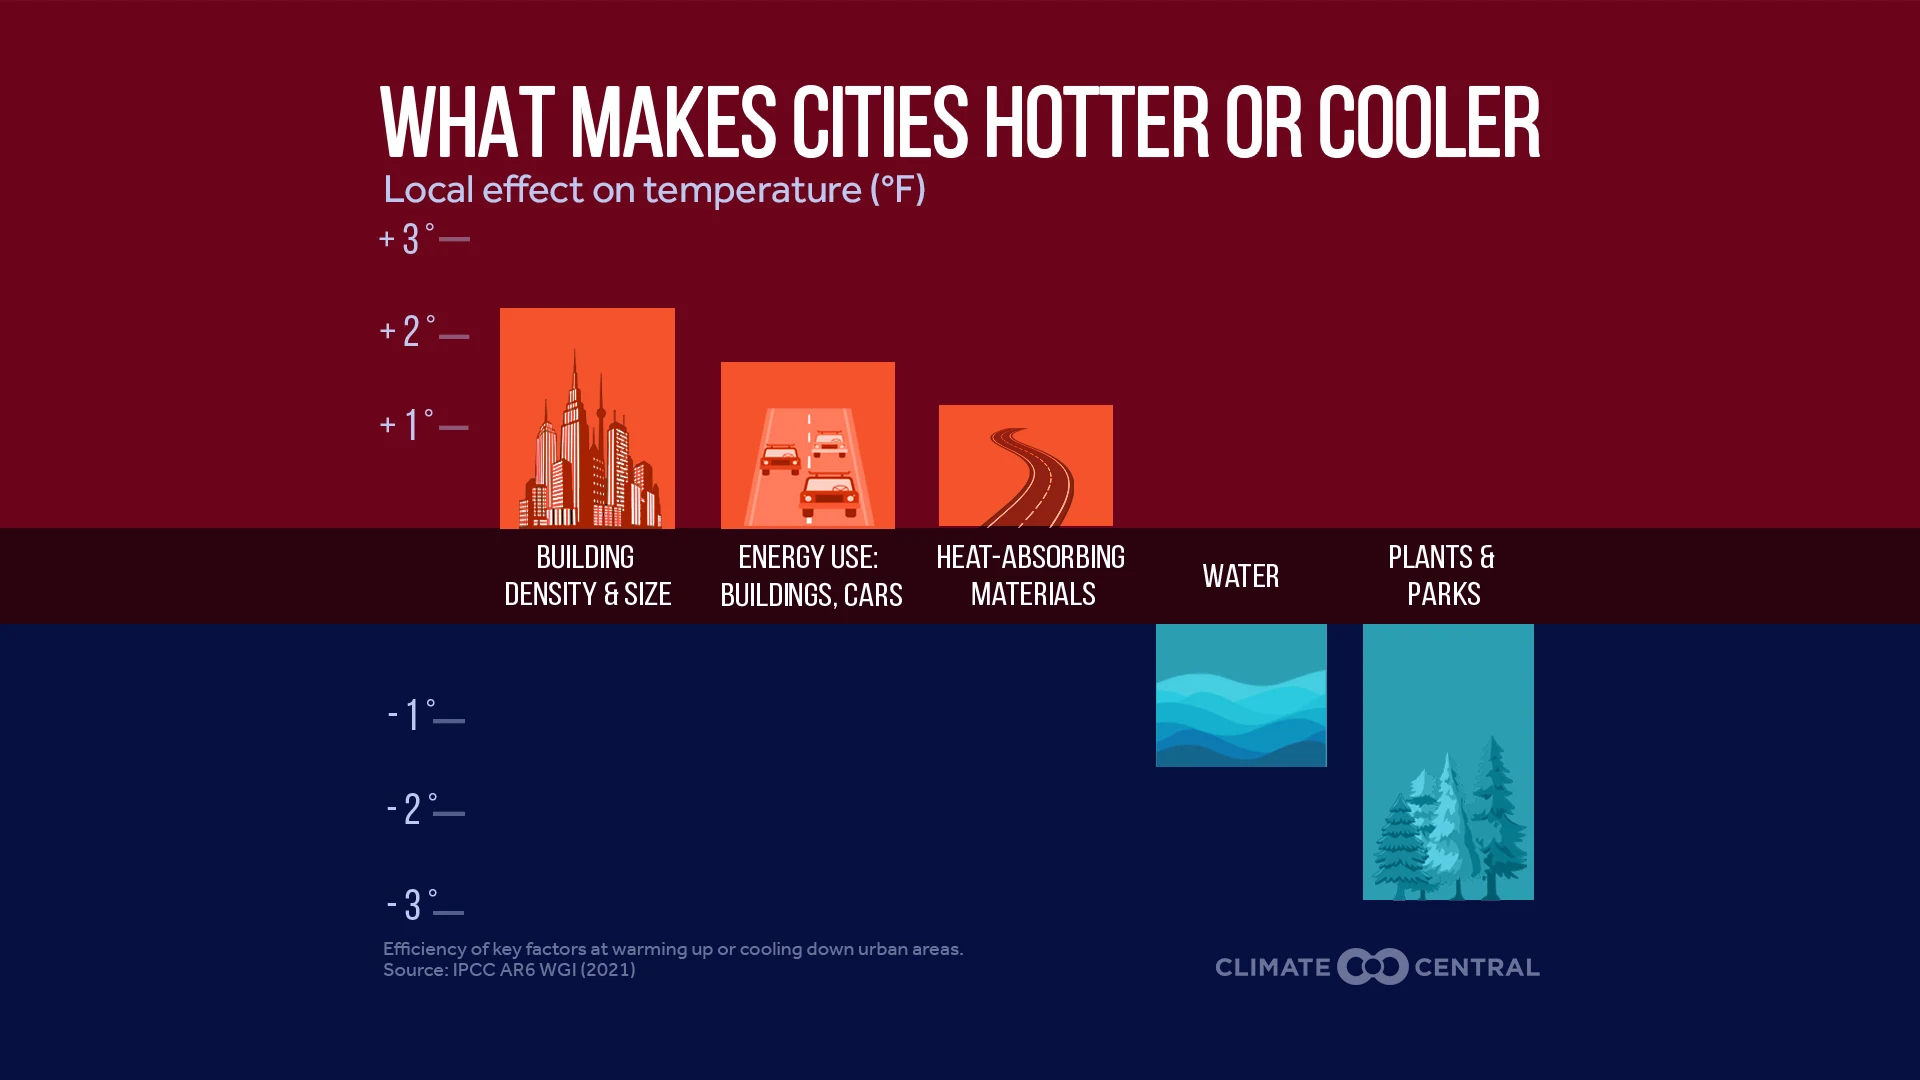
The “urban heat island” effect turns dense neighborhoods into slow ovens. Dark materials, heavy traffic, and limited vegetation trap heat, while uneven access to cooling deepens the divide.
Dark, impermeable surfaces absorb sunlight all day and release it after sunset, raising night temperatures.
Tree cover cools with shade + evapotranspiration. Many low-income areas have the least canopy.
Cooling is costly. Older buildings + high bills mean uneven protection and dangerous indoor heat.
High heat worsens smog and ozone, intensifying asthma and cardiovascular stress.
Heart works harder to move blood to the skin; dehydration increases stroke risk.
Repeated dehydration can damage kidneys — a rising concern for outdoor workers.
Hot nights disrupt sleep, driving fatigue, anxiety, and reduced daytime performance.