Used
- p5.js
Description
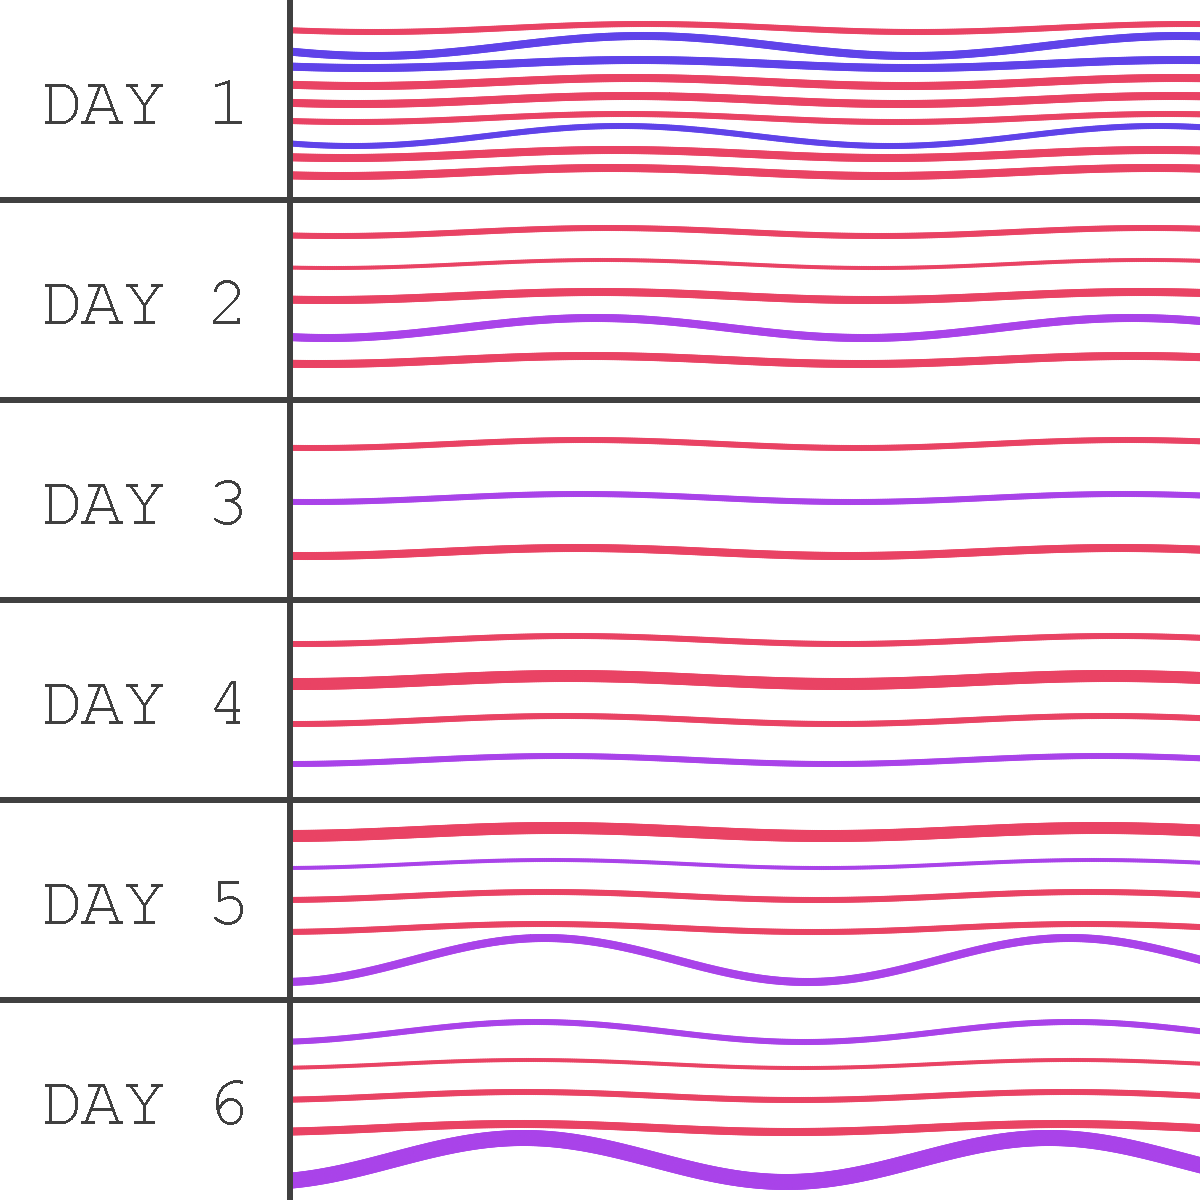
This data portrait visually shows how much video games I played during six days. Each wave represents a time I played a game.
The colors represent what I used to play the game:
- Blue: Controller
- Purple: Keyboard & Mouse
- Pink: Touch-Screen
The line thickness represents how long I played the game. The thicker the line, the longer I played. The amplitude represents how much fun I had when the game. The more amplitude on the wave, the more fun I had.


